Trunk Concurrent Calls Table
Overview
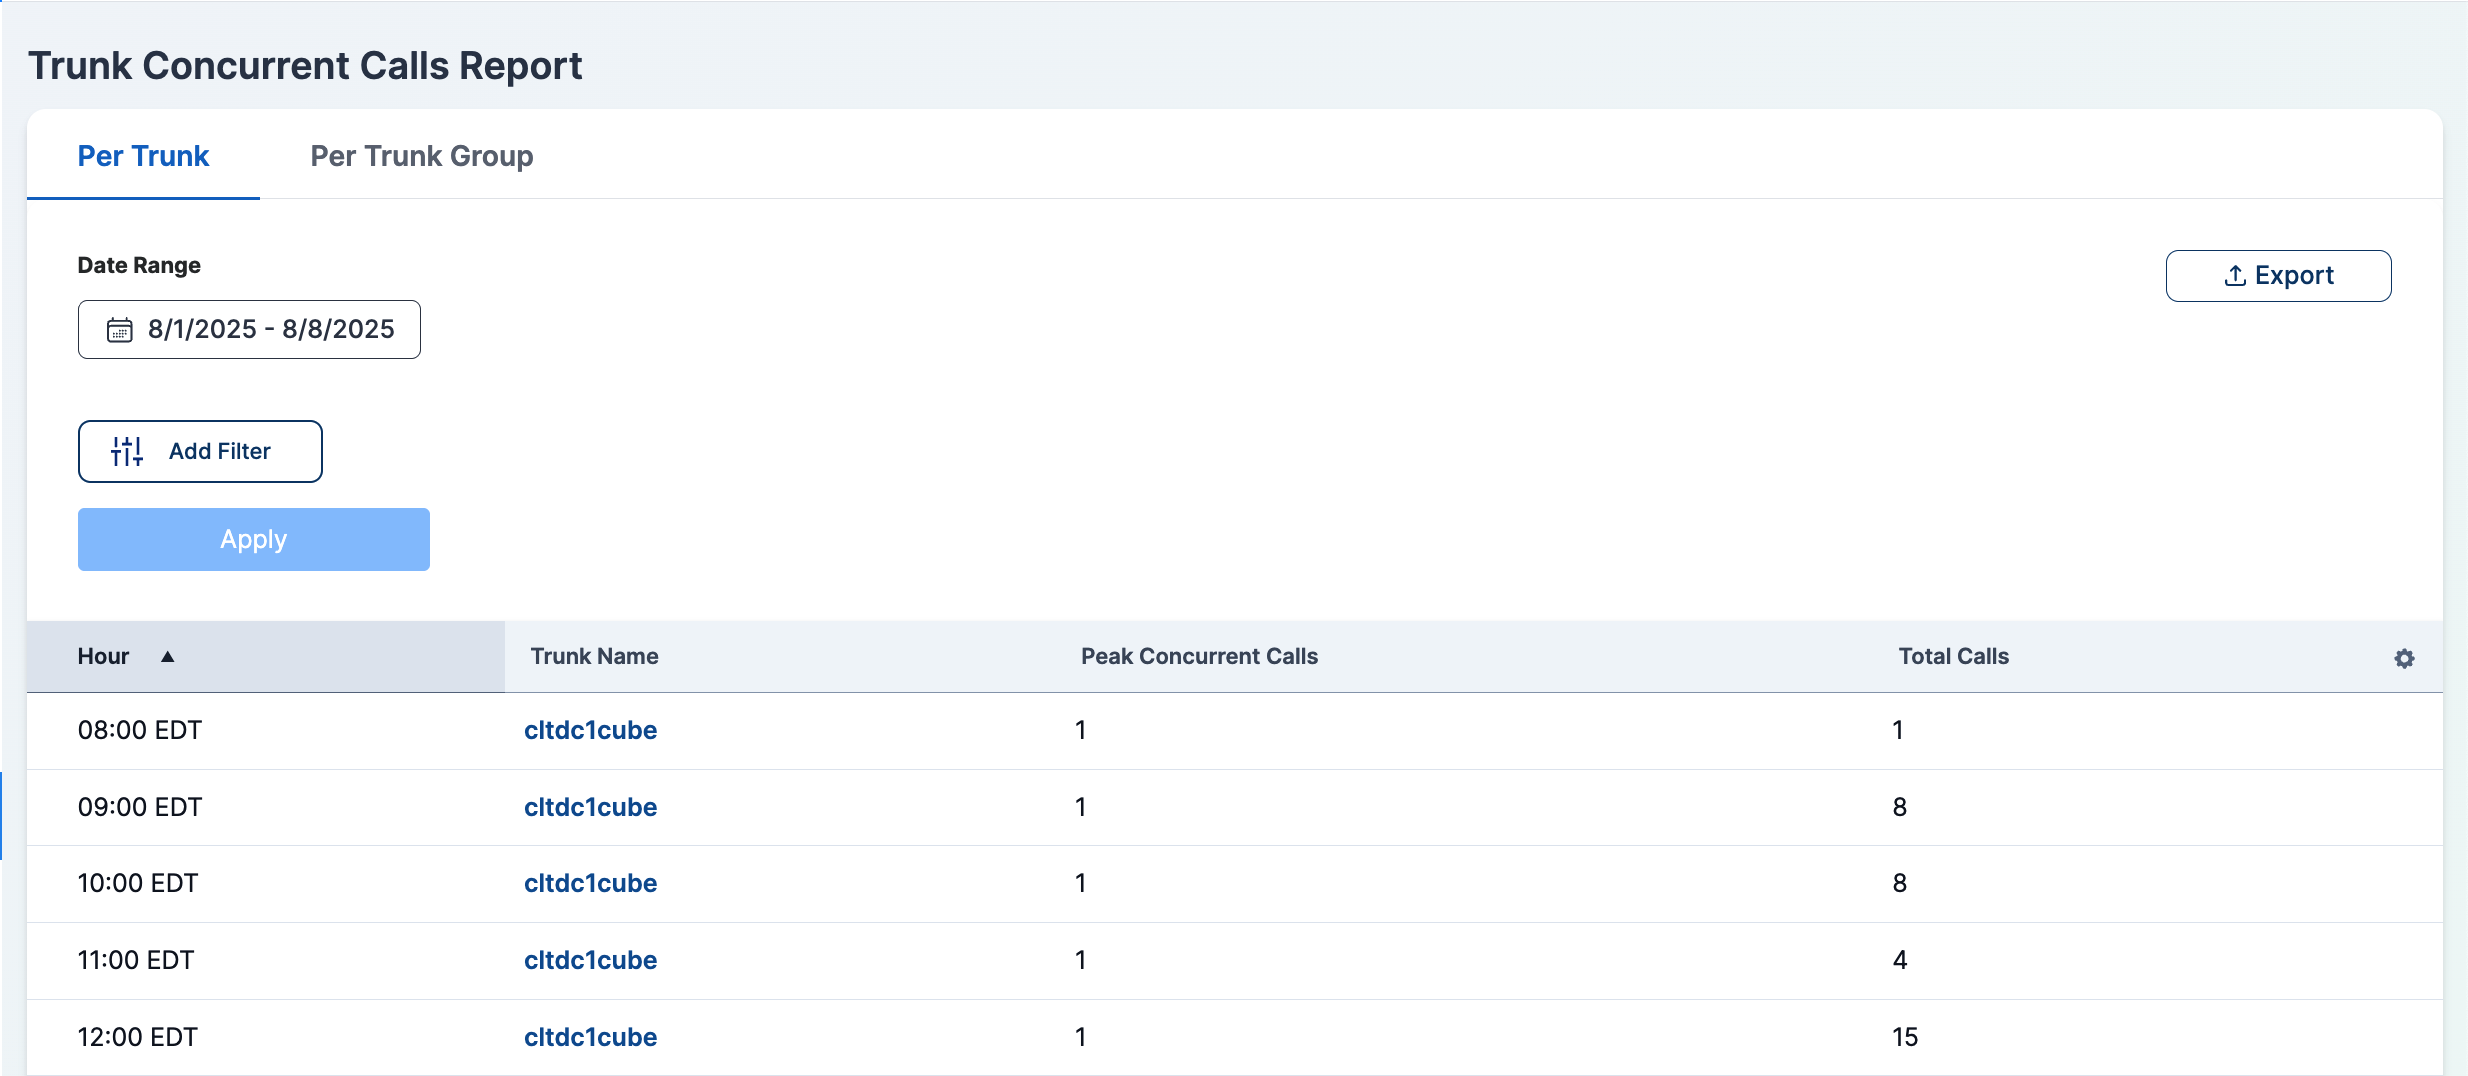
The Trunk Concurrent Calls Table provides a detailed breakdown of trunk and trunk group performance. It includes key metrics such as peak concurrent calls, and total calls in an hourly breakdown.
Navigating the Concurrent Calls Table
-
Access the Report
- Go to Trunk Concurrent Call Summary in Cloverhound Cloud.
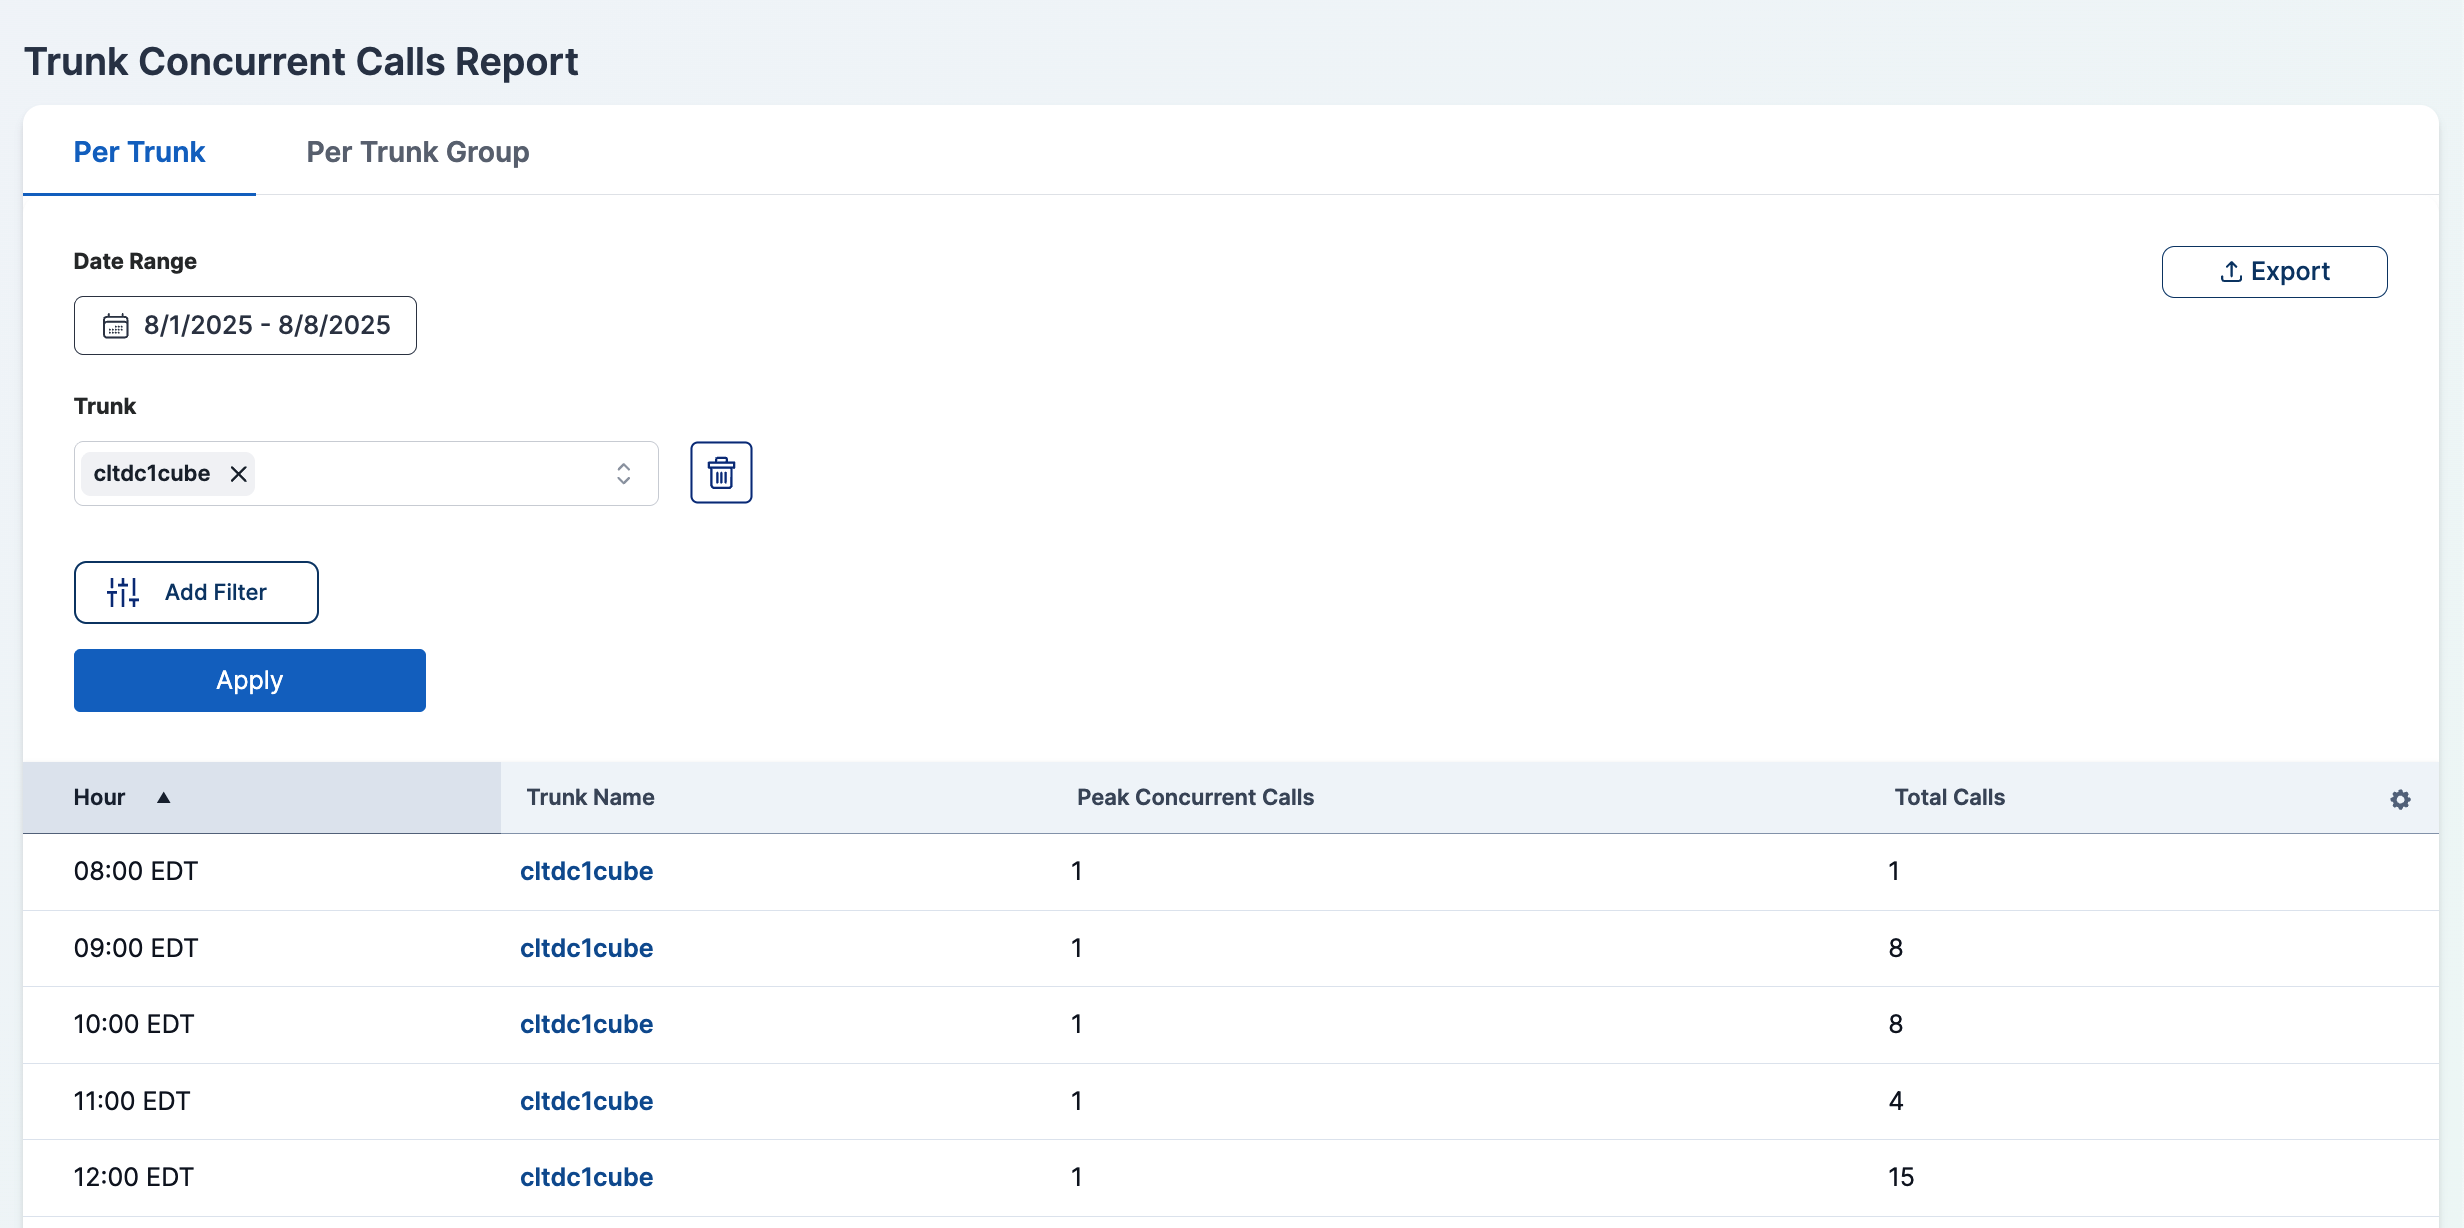
- Select either the Per Trunk or Per Trunk Group tab.
- Select a date range and specific trunks or trunk groups.
- Click Apply to view results.
-
Review Metrics
- The summary table displays key statistics for each trunk or trunk group.
Understanding the Table Columns
Per Trunk View
| Column | Description |
|---|---|
| Hour | The specific hour for the data entry. |
| Trunk Name | The name of the trunk. |
| Peak Concurrent Calls | The highest number of concurrent calls during that hour. |
| Total Calls | The total number of calls handled by the trunk during that hour. |
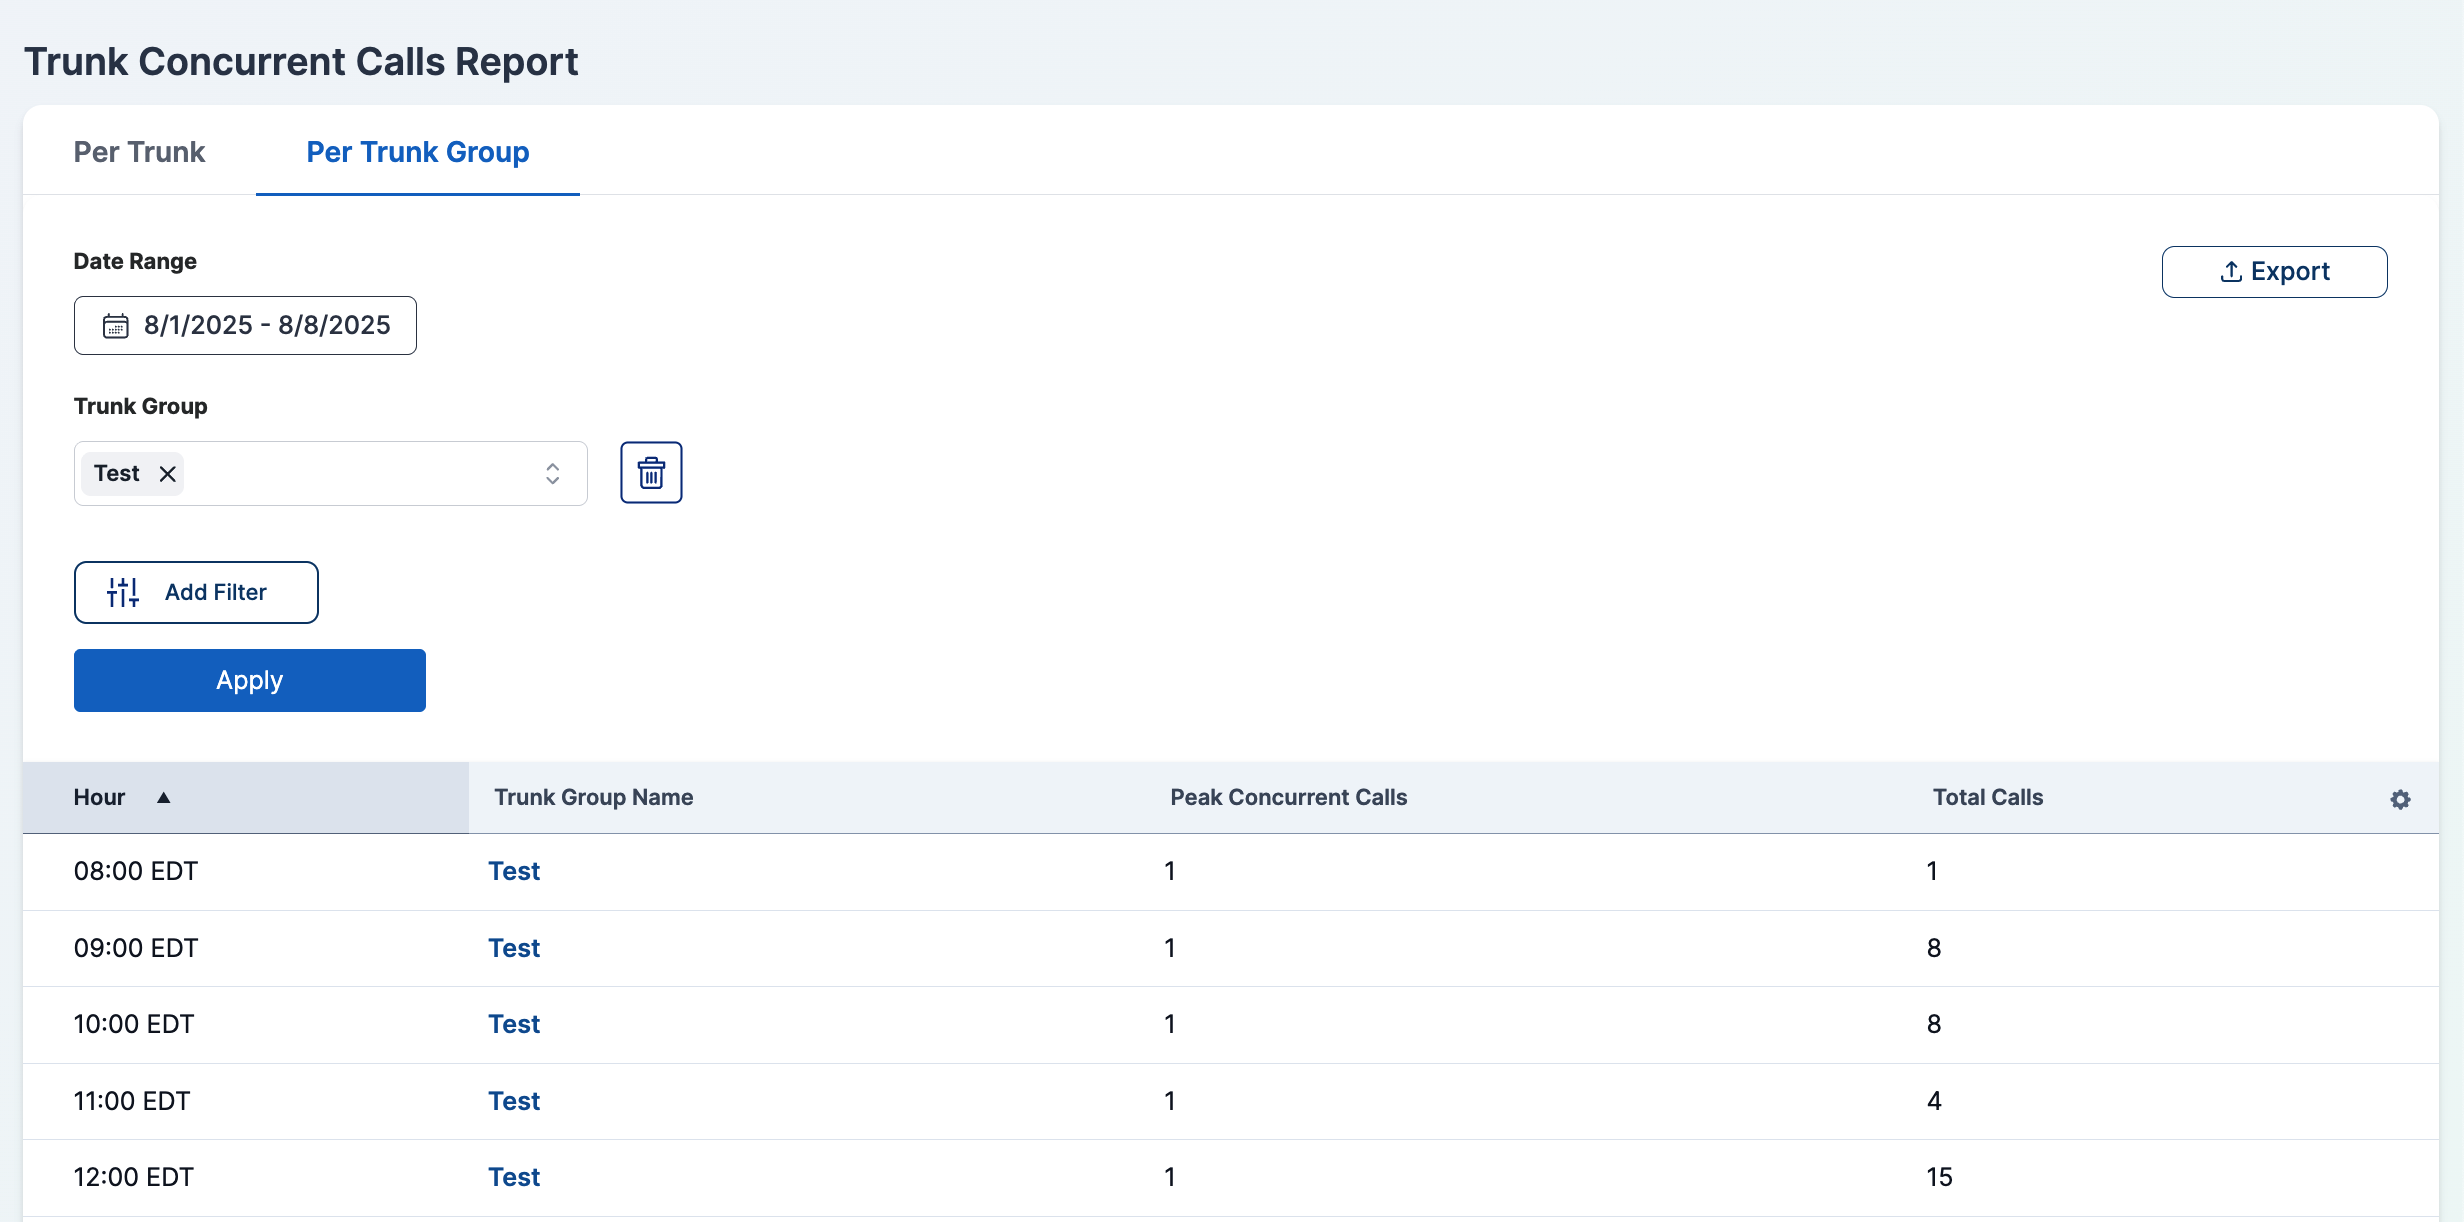
Per Trunk Group View
| Column | Description |
|---|---|
| Hour | The specific hour for the data entry. |
| Trunk Group Name | The name of the trunk group. |
| Peak Concurrent Calls | The highest number of concurrent calls across all trunks in the group during that hour. |
| Total Calls | The total number of calls handled by all trunks in the group during that hour. |
Filtering the Concurrent Calls Report
-
Select a Tab:
- Choose between Per Trunk or Per Trunk Group tabs.
-
Select a Date Range:
- Choose a start and end date to filter calls within a specific time frame.
-
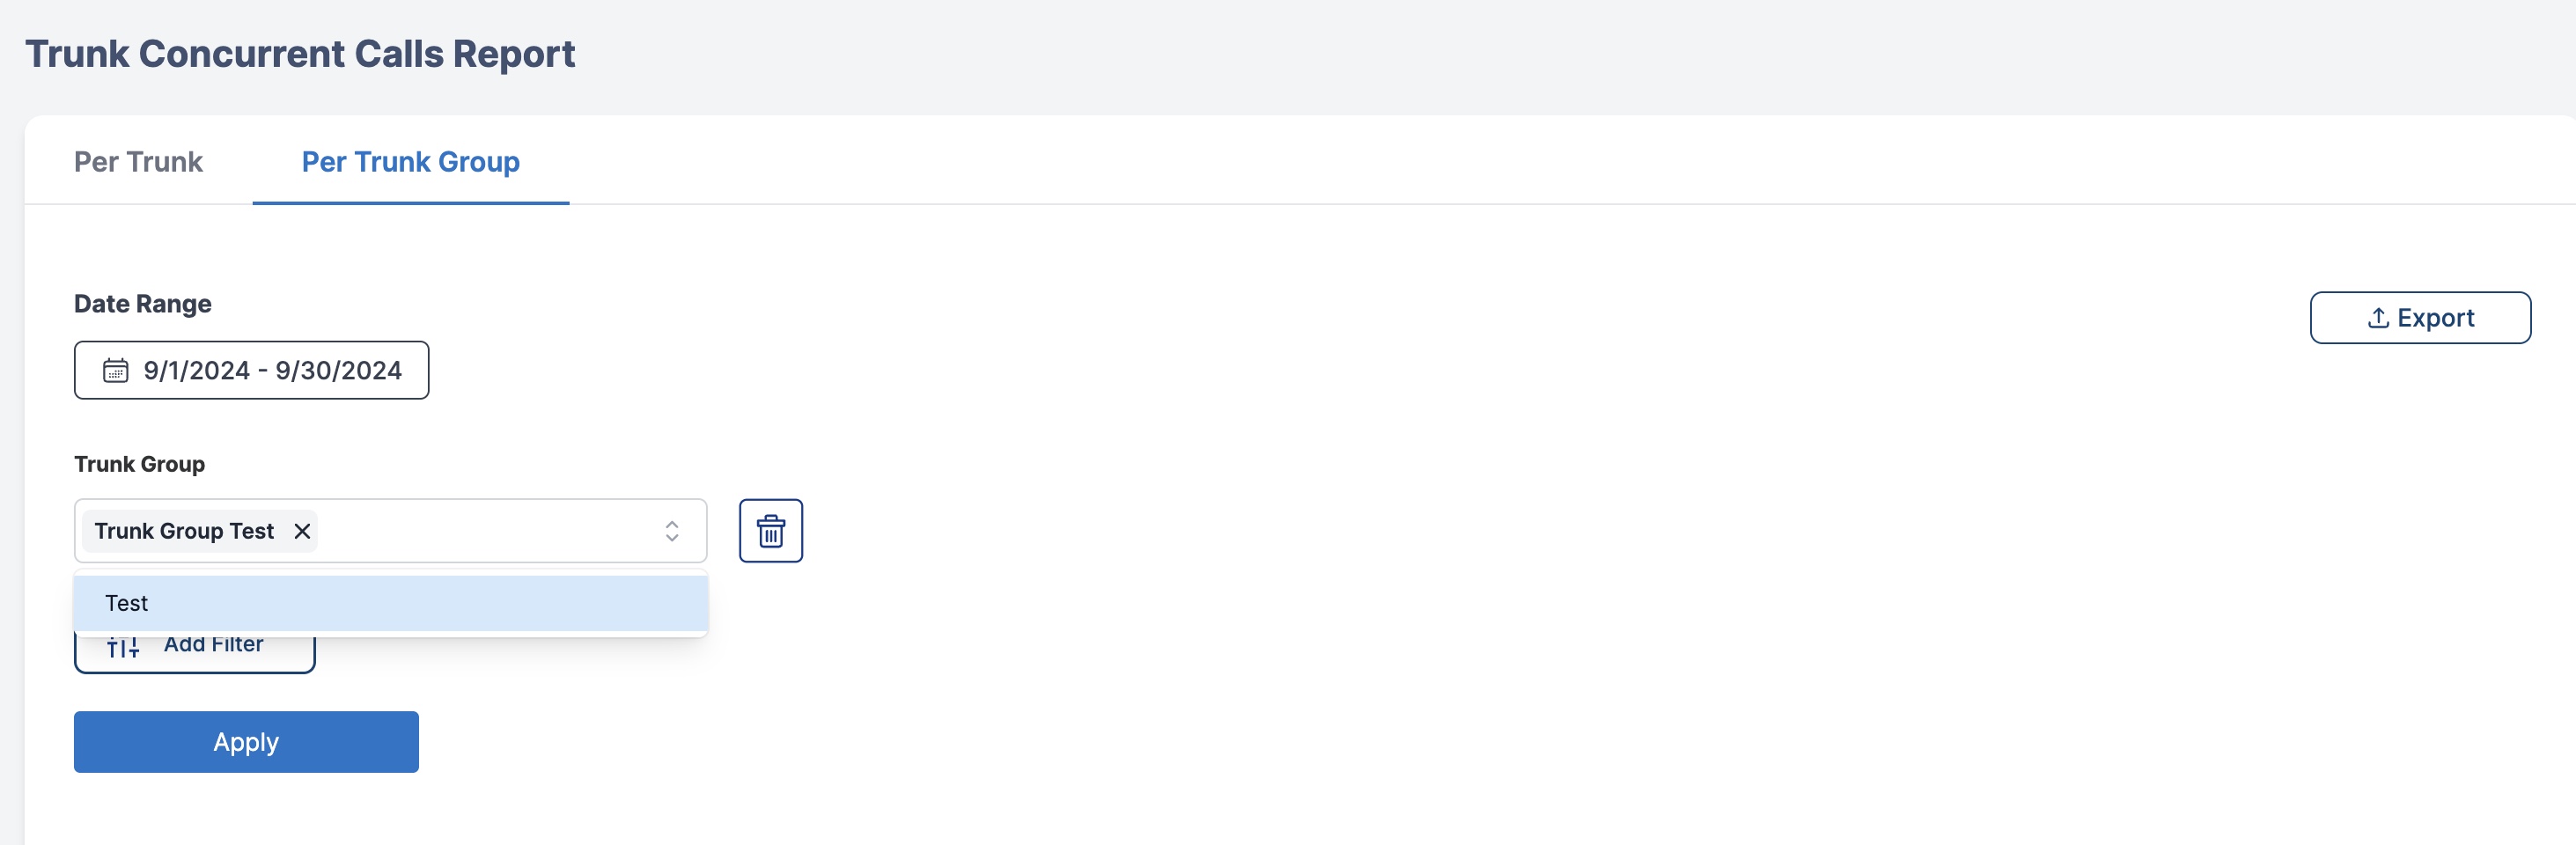
Select Trunks or Trunk Groups:
-
In the Per Trunk tab, use the dropdown to choose one or multiple trunks.
-
In the Per Trunk Group tab, use the dropdown to choose one or multiple trunk groups.
-
-
Click Apply:
- The report updates to display the filtered results.
Exporting Data
- Click the Export button.
- Choose the format (CSV, Excel, etc.).
- The file will be downloaded for further analysis.
Summary
The Trunk Concurrent Calls Table allows administrators to:
- Track and analyze call concurrency trends for each trunk or trunk group.
- Compare performance between individual trunks and grouped trunks.
- Apply filters for more refined data analysis.
- Export reports for further review and decision-making.
Use this report to optimize trunk capacity and improve call handling efficiency.