Call Queue Summary Report
The Call Queue Summary Report in Cloverhound Cloud provides insights into the performance and activity of call queues in your organization. This guide explains how to access and interpret the summary data.
Accessing the Call Queue Summary Report
-
Navigate to the Call Queues Summary Page:
- Go to the Analytics section in the main menu.
- Select Call Queues Summary.
-
Apply Filters:
- Use the Date Range filter to view calls from a specific time period.
- Filter by Call Queue to analyze a specific queue’s performance.
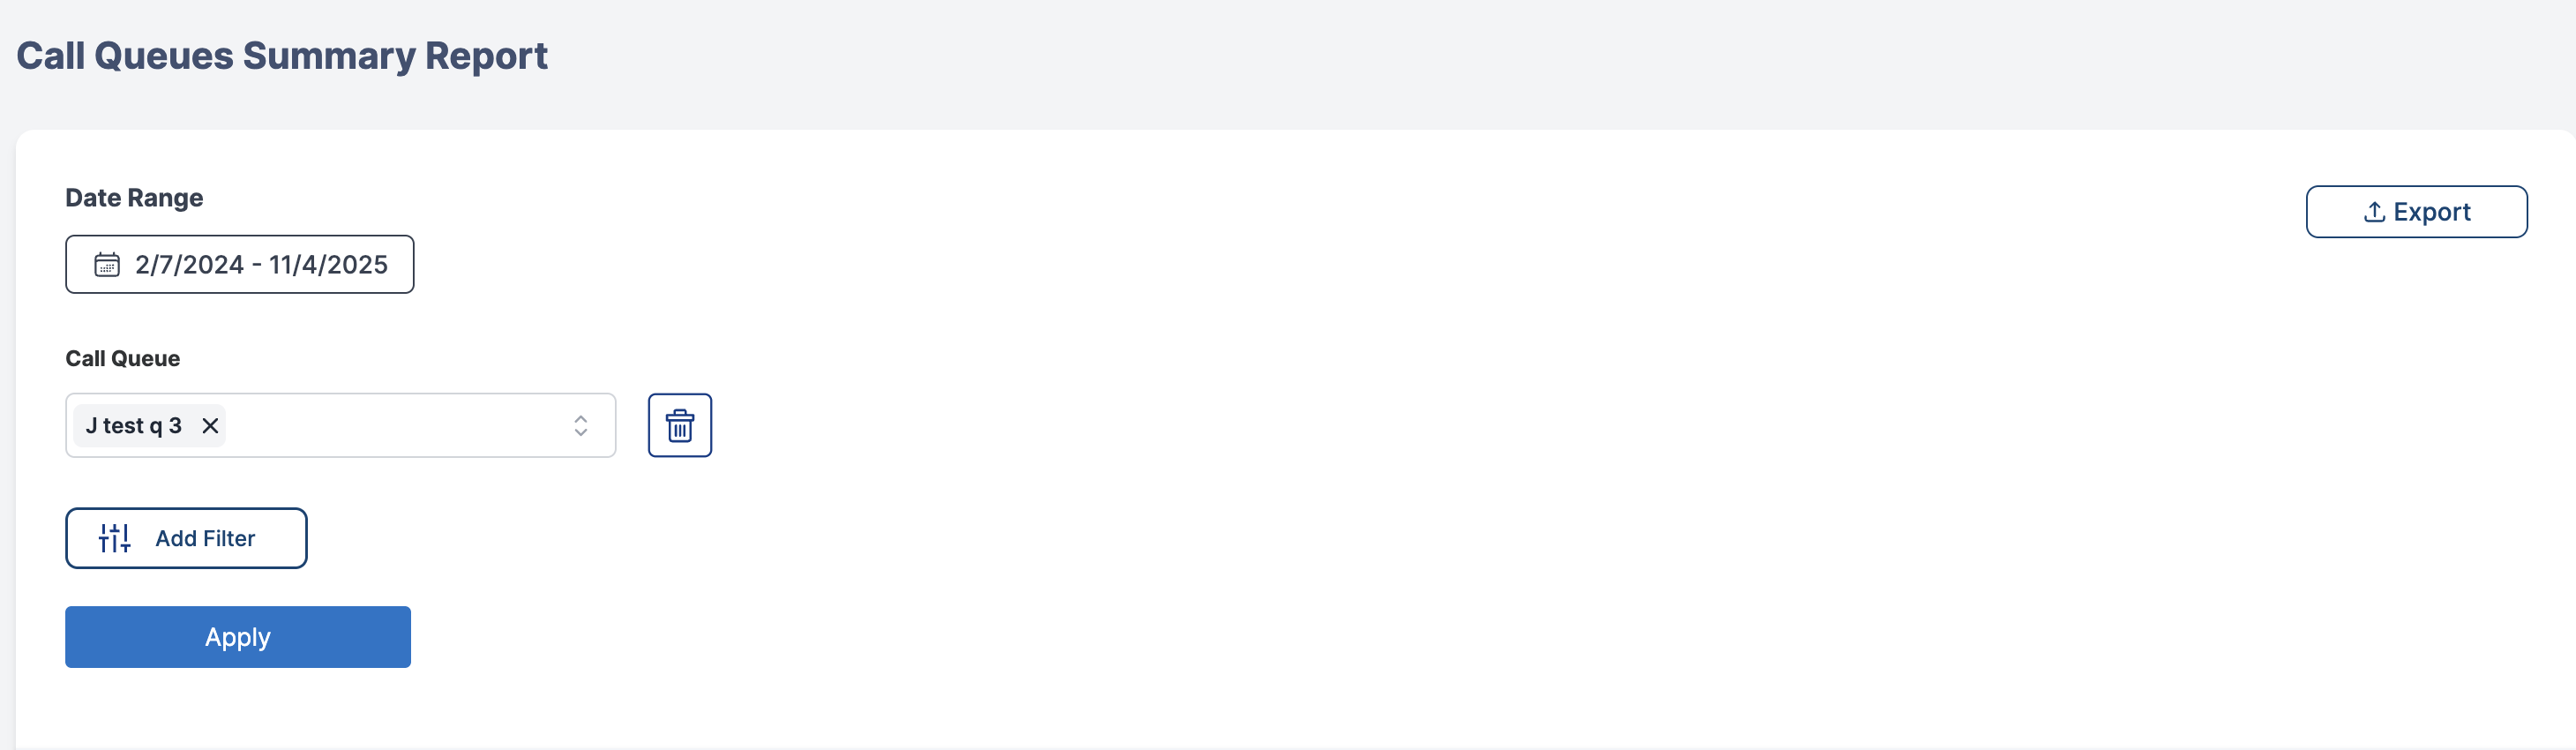
-
Understanding the Summary Table: The summary table displays key metrics for each call queue:
Metric Description Call Queue Name The name of the call queue. Total Calls The total number of calls received by the queue. Answered Calls Number and percentage of calls that were answered. Abandoned Calls Number and percentage of calls where the caller hung up. Avg Call Duration Average duration of calls handled by the queue. Peak Hour The busiest hour for incoming calls to the queue. 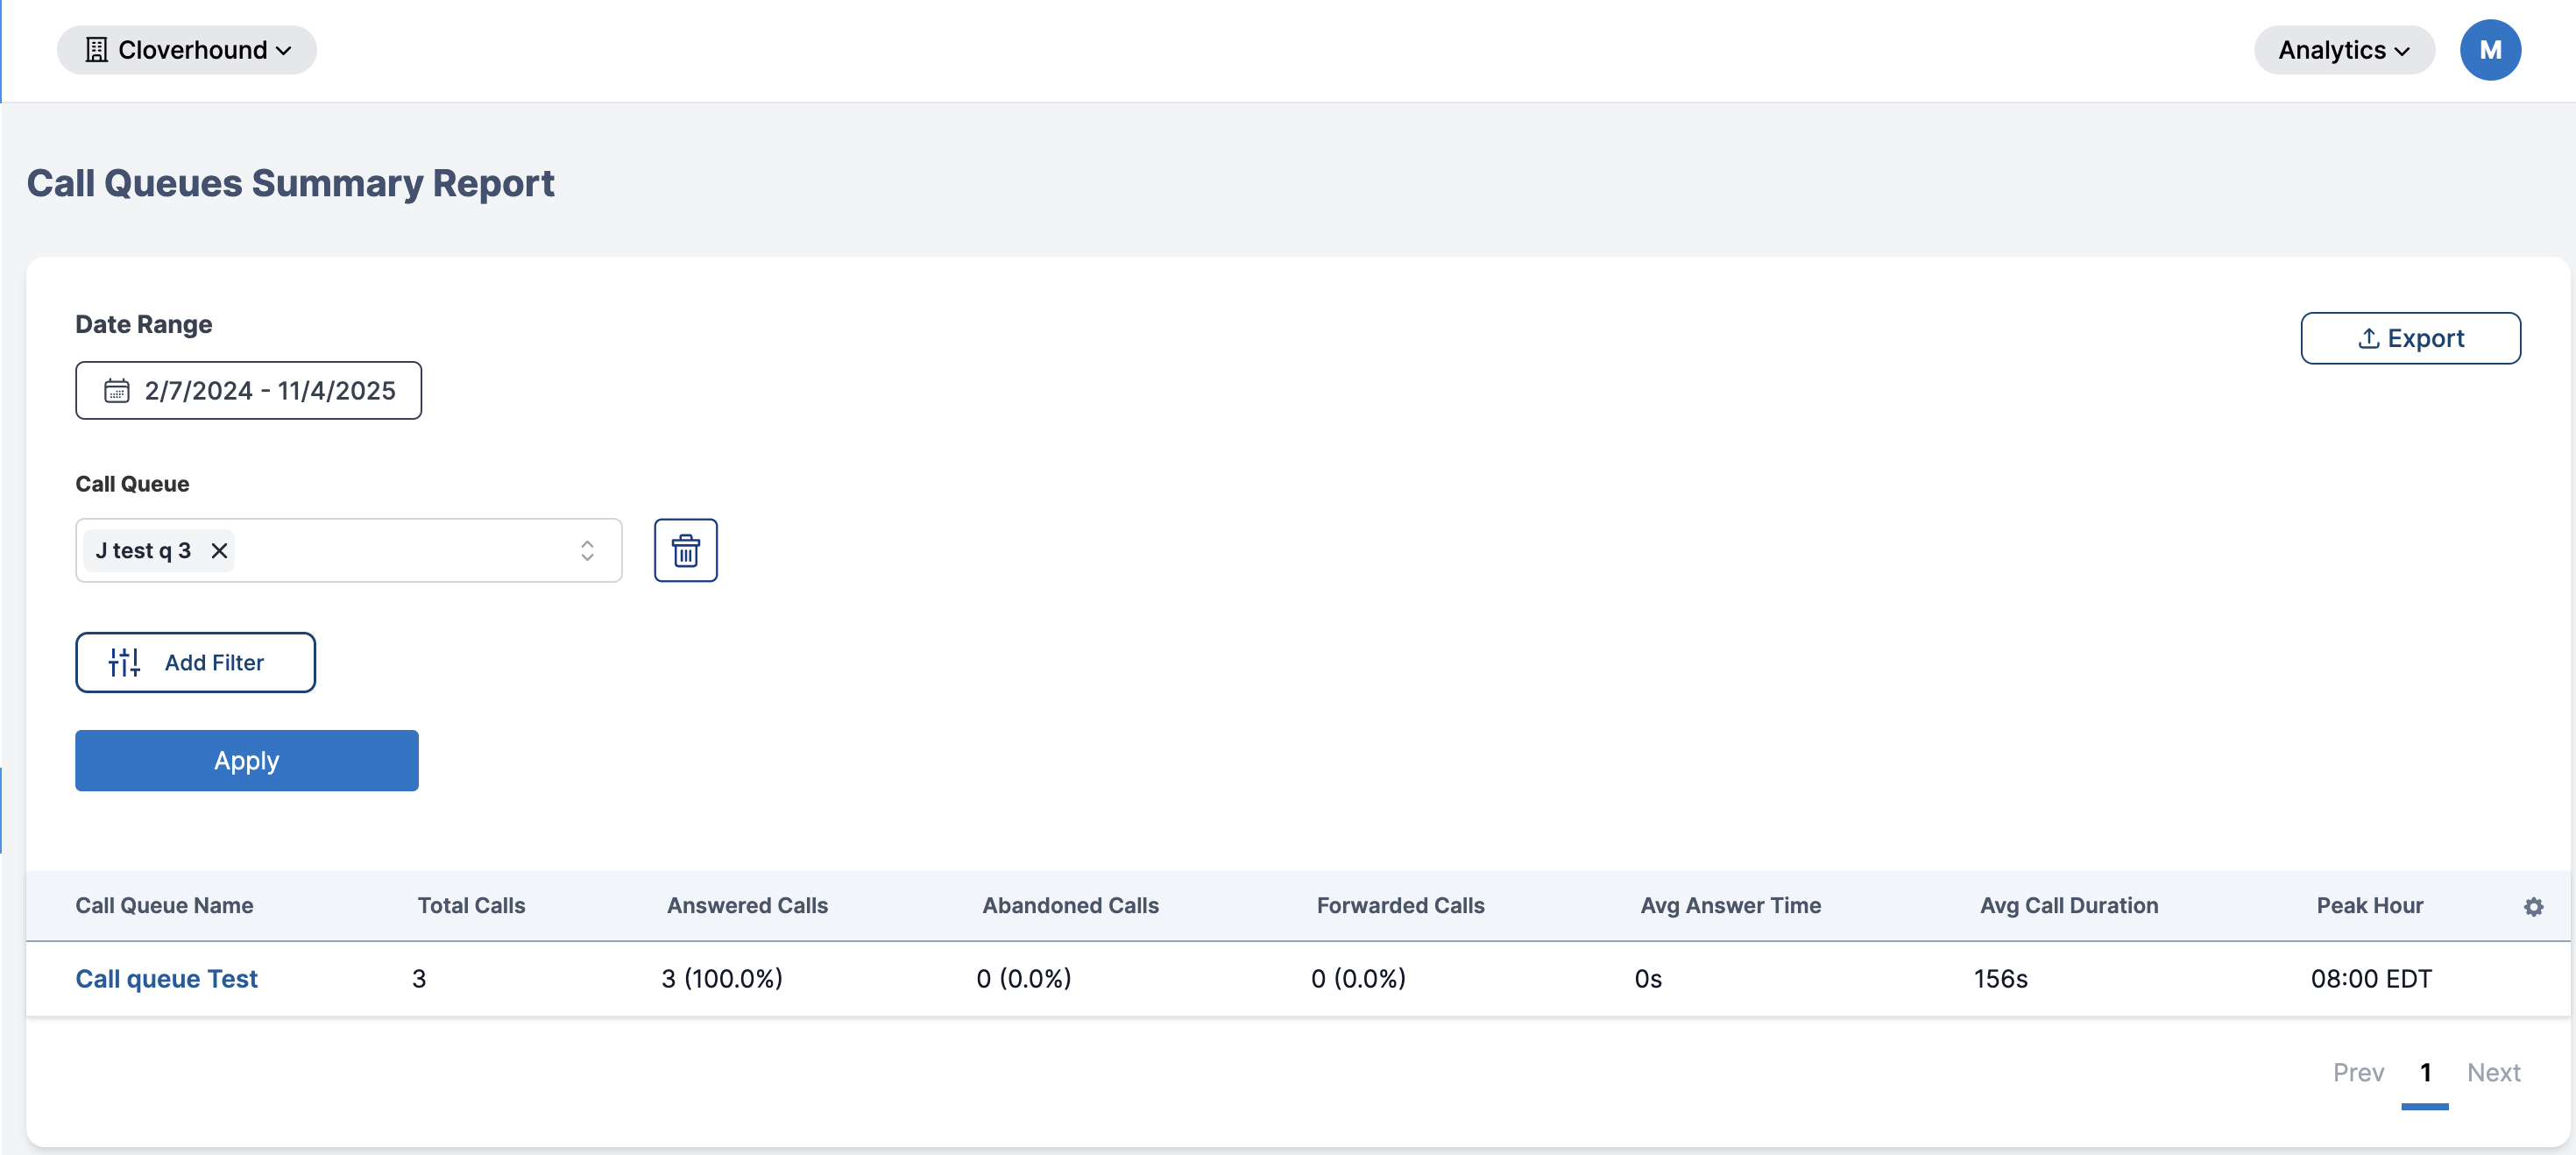
-
Exporting Data:
- Click on the Export button to download reports in CSV, PDF, or Excel formats.
By using the Call Queue Summary Report, you can monitor queue efficiency, identify bottlenecks, and optimize your call routing strategy.